The Kansas Rainfall Map is a comprehensive resource for anyone interested in understanding the weather patterns in Kansas. Our interactive map provides users with a detailed overview of the average rainfall levels across the state, enabling them to plan their activities accordingly. Whether you’re a farmer, a gardener, or an outdoor enthusiast, our Kansas Rainfall Map is an invaluable tool to help you stay prepared and make informed decisions.
Check out our other Rainfall related Maps:
- California Rainfall Map
- Texas Rainfall Map
- Colorado Rainfall Map
- Oregon Rainfall Map
- Arizona Rainfall Map
- Hawaii Rainfall Map
Kansas Rainfall Map
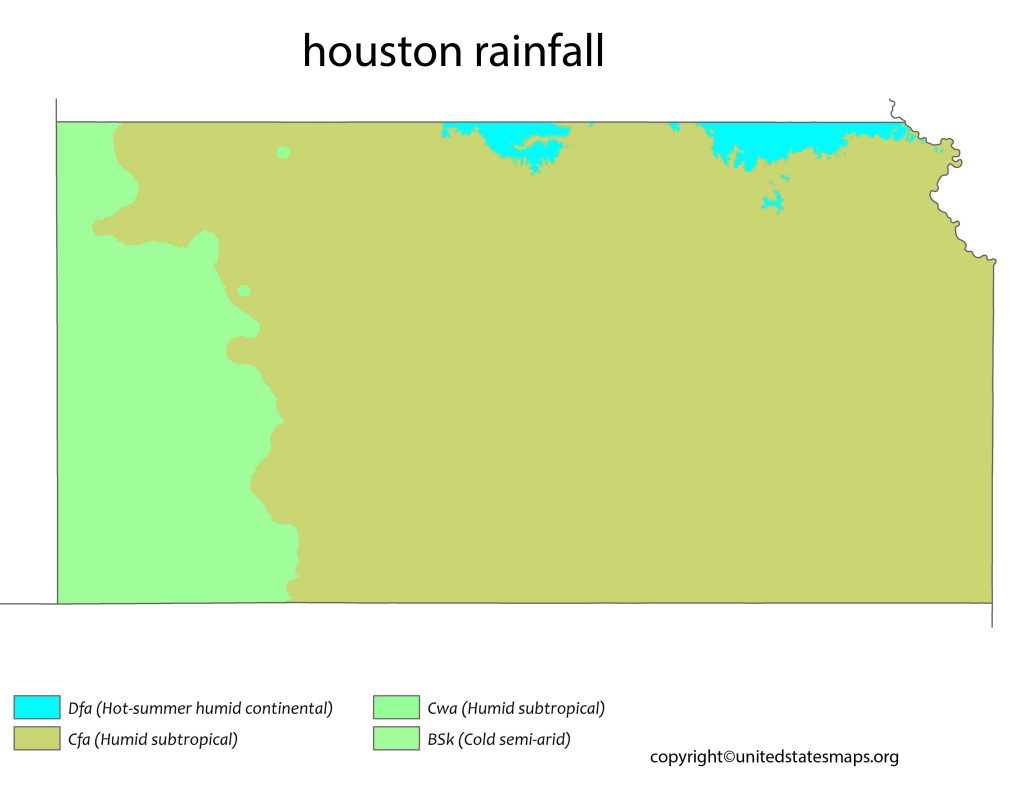
The American state of Kansas is situated in the Midwest. Large plains, wheat farms, and a flat landscape are some of its most notable features. The state experiences moderate to low annual rainfall due to its semi-arid environment. A rainfall map of Kansas is a helpful tool for figuring out how much rain falls where in the state.
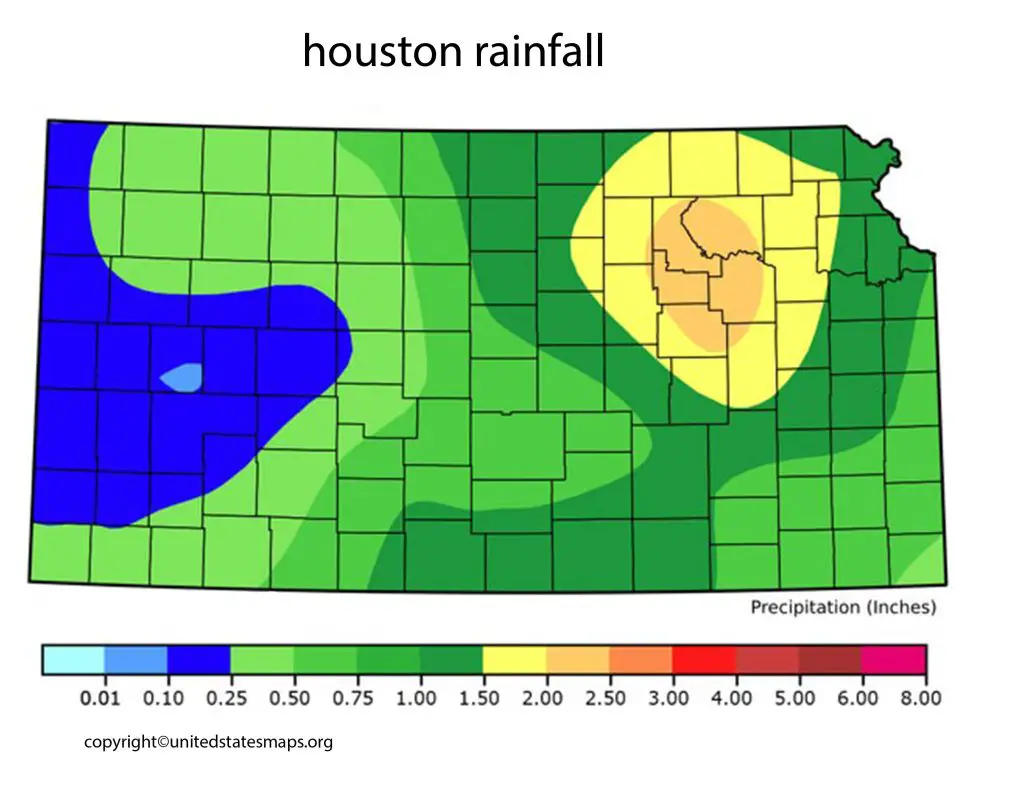
The map shows that the eastern part of Kansas receives higher levels of rainfall than the western region. The state’s average annual precipitation ranges from 20 inches in the west to 45 inches in the east. This difference in precipitation levels is due to the state’s location in the rain shadow of the Rocky Mountains. The western part of the state receives less rainfall due to the mountains blocking the moisture from the west.
The rainfall map of Kansas shows the distribution of precipitation across the state. Precipitation in Kansas comes in many forms, including rain, snow, sleet, and hail. The map displays the average annual precipitation levels for each county in the state.
The Kansas rainfall map is important for many reasons. Farmers and ranchers rely on rainfall to grow crops and raise livestock. The map helps them to plan for planting, harvesting, and managing their operations. It also assists with water resource management, drought monitoring, and flood forecasting. The map helps state and local governments plan for infrastructure projects and emergency response.
Rainfall Map of Kansas
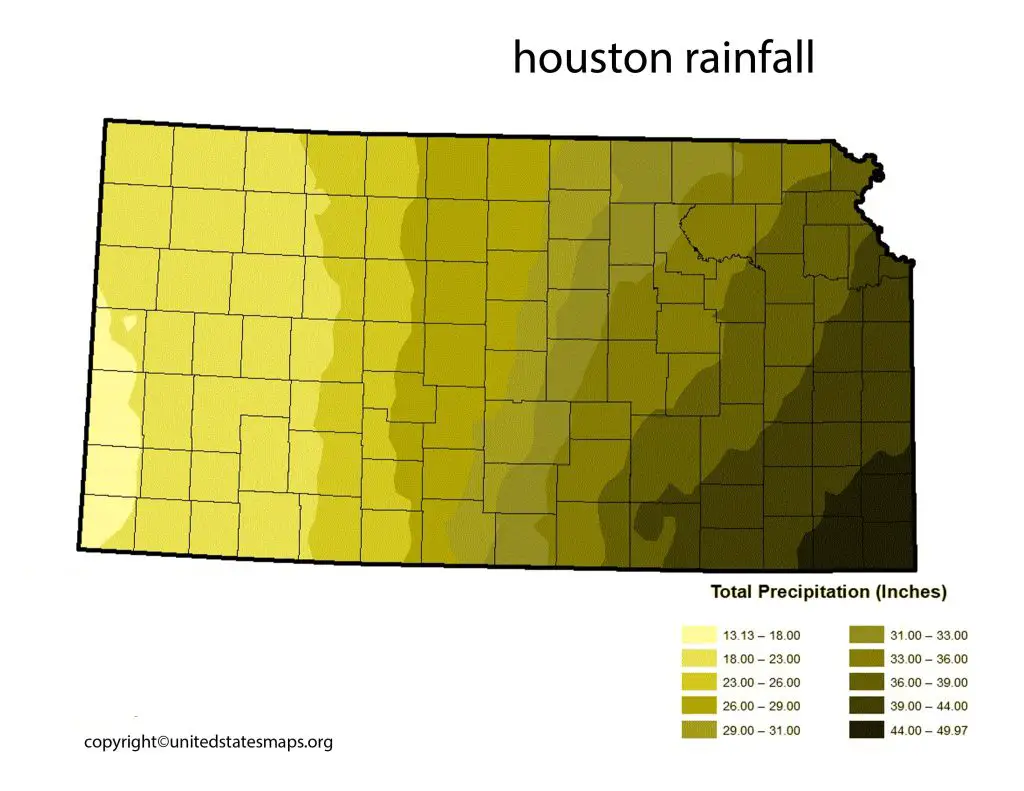
The annual rainfall map Kansas displays the total amount of precipitation that falls across the state in a year. The map is based on data collected from weather stations across the state and provides a valuable tool for understanding the state’s weather patterns. The map shows that Kansas receives an average of 30 inches of precipitation per year. However, precipitation levels can vary widely across the state, with some areas receiving much more or much less rainfall than others.
The eastern part of the state, which includes cities like Kansas City and Topeka, receives the highest levels of precipitation, with averages ranging from 40 to 45 inches per year. The central and western regions of the state, which are more sparsely populated, receive less rainfall, with averages ranging from 20 to 30 inches per year. The driest region of the state is the southwestern corner, which receives as little as 16 inches of precipitation per year.
The rainfall map of Kansas is an important tool for understanding the state’s climate and weather patterns. It is particularly useful for farmers, ranchers, and water resource managers who rely on precipitation for their livelihoods. The map helps them to plan for crop planting and irrigation, manage water resources, and prepare for droughts and floods.
Kansas Average Rainfall Map
The annual rainfall map of Kansas is important for understanding the state’s climate and weather patterns. It is particularly useful for farmers and ranchers who rely on precipitation for their livelihoods. The map helps them to plan for crop planting and irrigation, manage water resources, and prepare for droughts and floods.
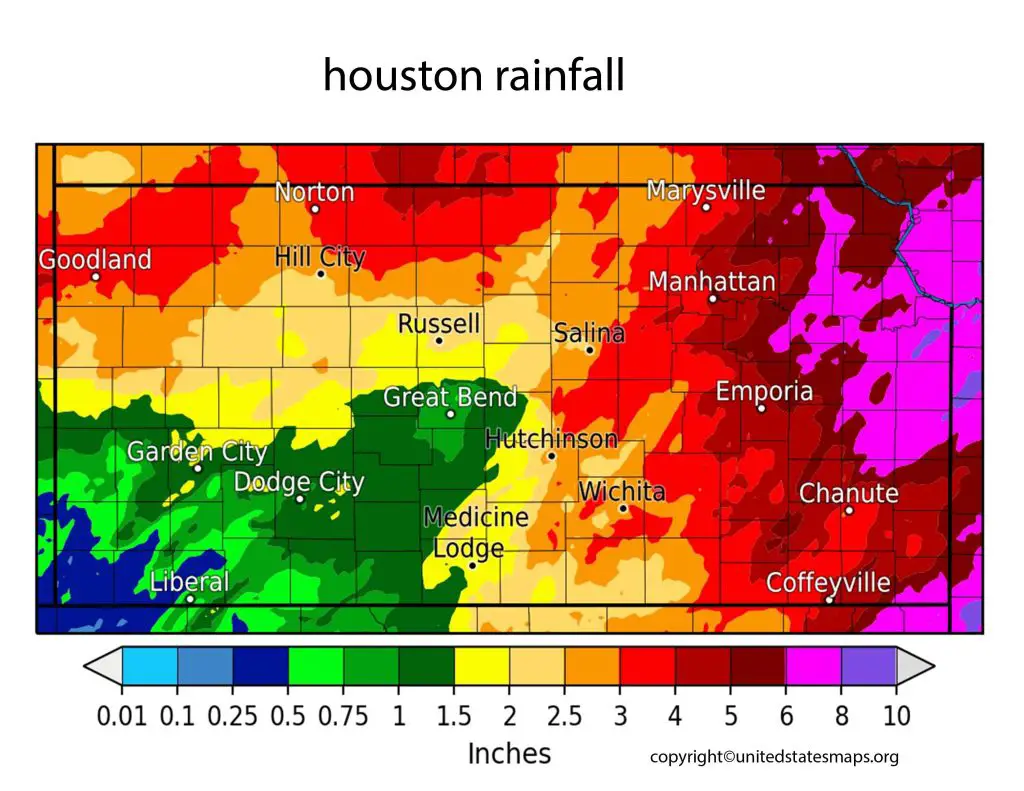
The Kansas average rainfall map displays the average annual precipitation levels across the state. It is based on data collected from weather stations across the state over a period of several decades. The map provides valuable information about the state’s climate and weather patterns.
The map shows that the average annual precipitation levels in Kansas range from 16 inches in the southwest to 45 inches in the northeast. The eastern part of the state receives the highest levels of precipitation, while the western part of the state is much drier. But this difference in precipitation levels is due to the state’s location in the Great Plains and its proximity to the Rocky Mountains.
The Kansas average rainfall map is important for many reasons. It helps farmers and ranchers plan for crop planting and irrigation, manage water resources, and prepare for droughts and floods. And then the map is also useful for urban planners and emergency management officials, who use it to identify areas that are prone to flooding and to plan for infrastructure projects that can mitigate the impacts of heavy rainfall.
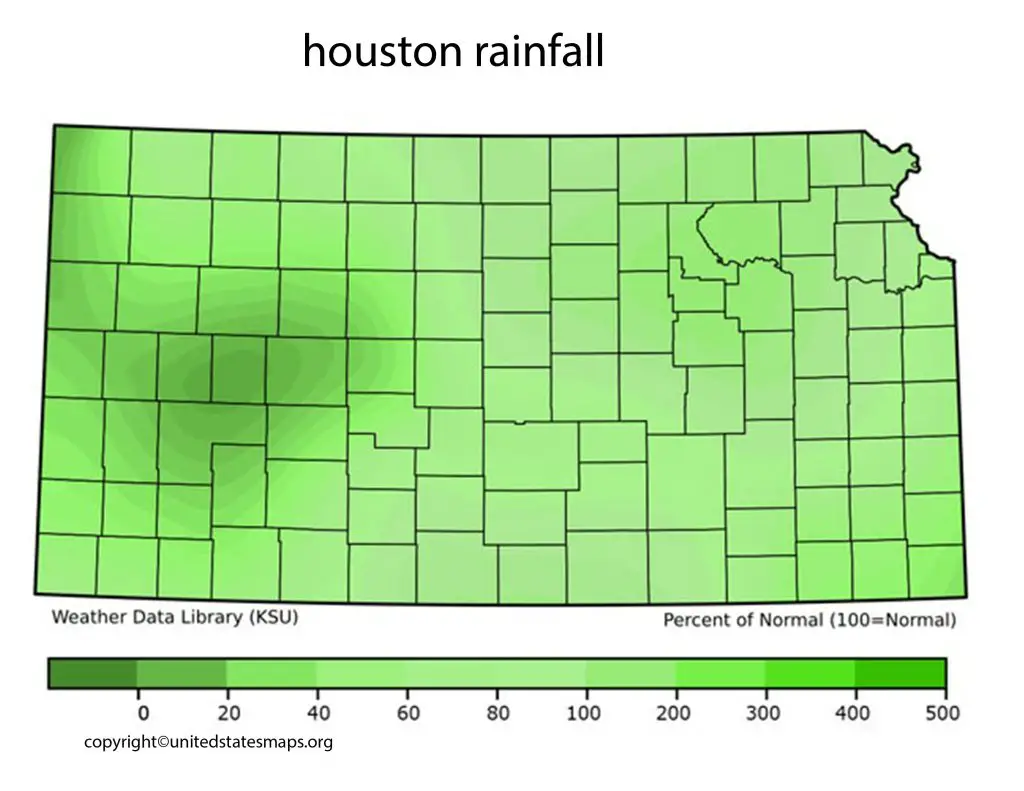
The map can also be used to track changes in precipitation patterns over time. This information is important for understanding how climate change is affecting the state’s weather patterns and for planning for future climate impacts.