The Oregon Rainfall Map is an essential resource for anyone interested in understanding the weather patterns in the state. Our comprehensive map provides users with a clear overview of the average rainfall levels across the state, enabling them to plan their activities accordingly. Whether you’re a farmer, a hiker, or just want to stay informed about the weather, our Rainfall Map of Oregon a must-have tool.
Check out our other Rainfall related Maps:
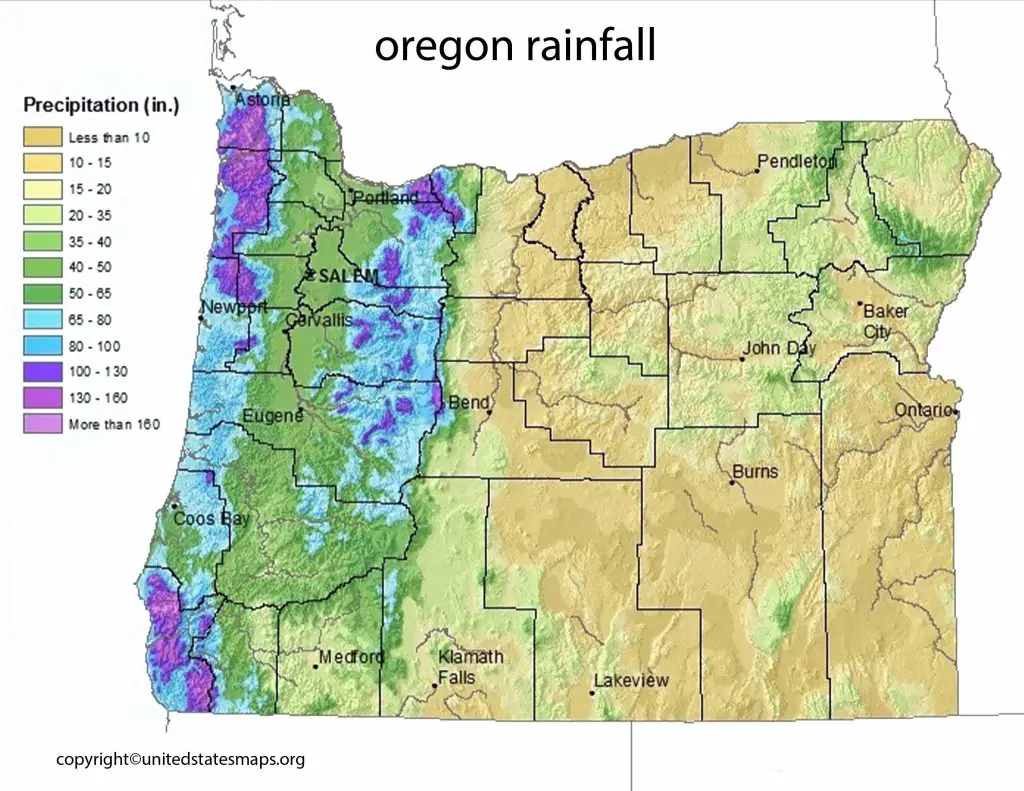
Oregon, located in the Pacific Northwest region of the United States, experiences a diverse range of precipitation patterns due to its varying topography and climate zones. The state’s western regions receive heavy rainfall, while the eastern regions receive considerably less precipitation. To visualize the distribution of rainfall across the state, Oregon’s Rainfall Map provides a comprehensive overview of the annual precipitation data.
The map shows the rainfall distribution across Oregon, with the coastal region receiving the highest annual rainfall of approximately 60 inches. The western valleys and the Cascade Range also receive significant precipitation, ranging between 25-60 inches annually. In contrast, the eastern regions, including the High Desert, receive less than 10 inches of rainfall per year.
The Oregon Rainfall Map helps farmers, water resource managers, and emergency services to prepare for potential water shortages or floods. It also helps to inform planning decisions for new construction, land use management, and other infrastructure development projects.
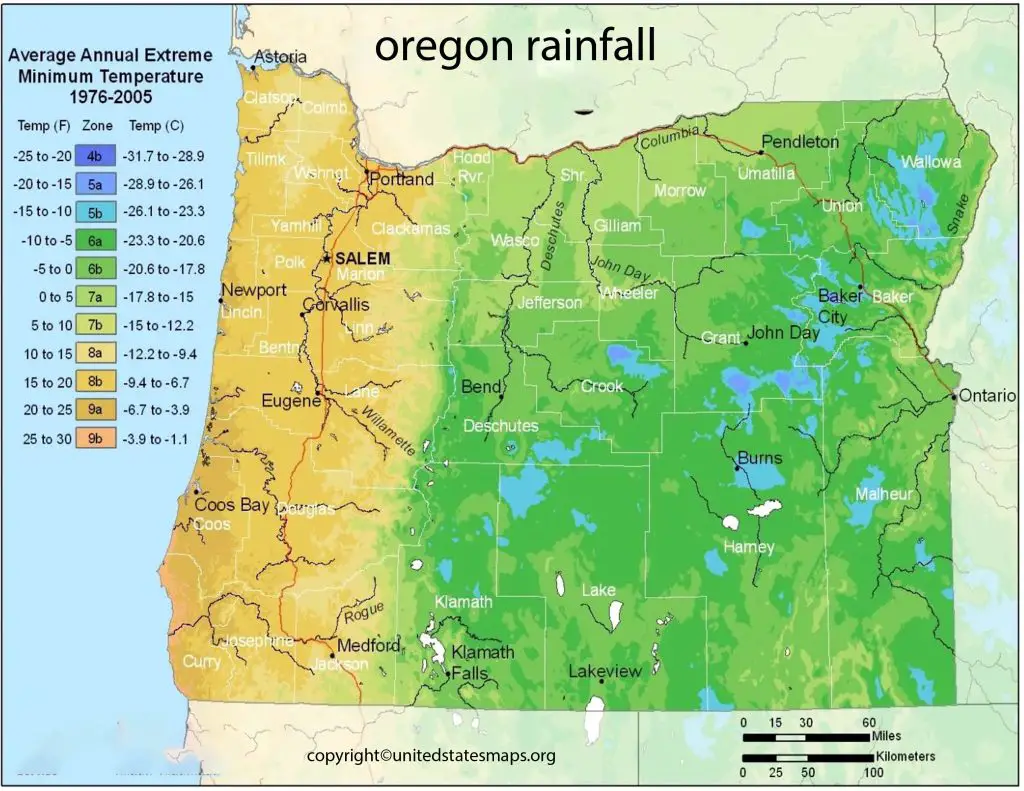
Rainfall Map of Oregon
The Annual Rainfall Map of Oregon provides a detailed overview of the state’s average precipitation levels. The map shows that Oregon’s precipitation patterns are influenced by its topography, with the western side receiving much more rainfall than the eastern side.
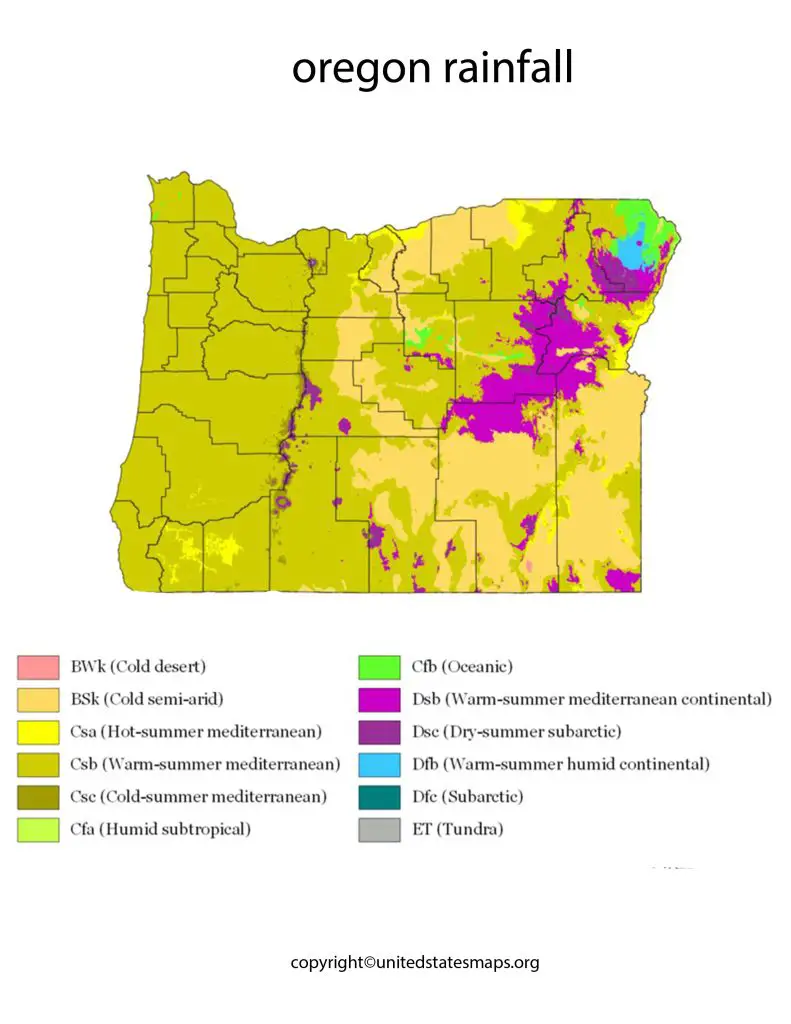
The Rainfall Map of Oregon highlights the annual precipitation patterns across the state. The map depicts the precipitation in inches, and it’s an essential tool for meteorologists, hydrologists, and other scientists interested in Oregon’s weather patterns.
The map shows that Oregon’s rainfall mainly concentrated on the western side of the state, with the coastal region experiencing the most significant rainfall. The valleys and the Cascade Range also receive substantial rainfall, while the eastern region receives much less. The map’s visualization provides insights into the region’s annual precipitation variability and how influenced by topography, wind patterns, and other weather phenomena.
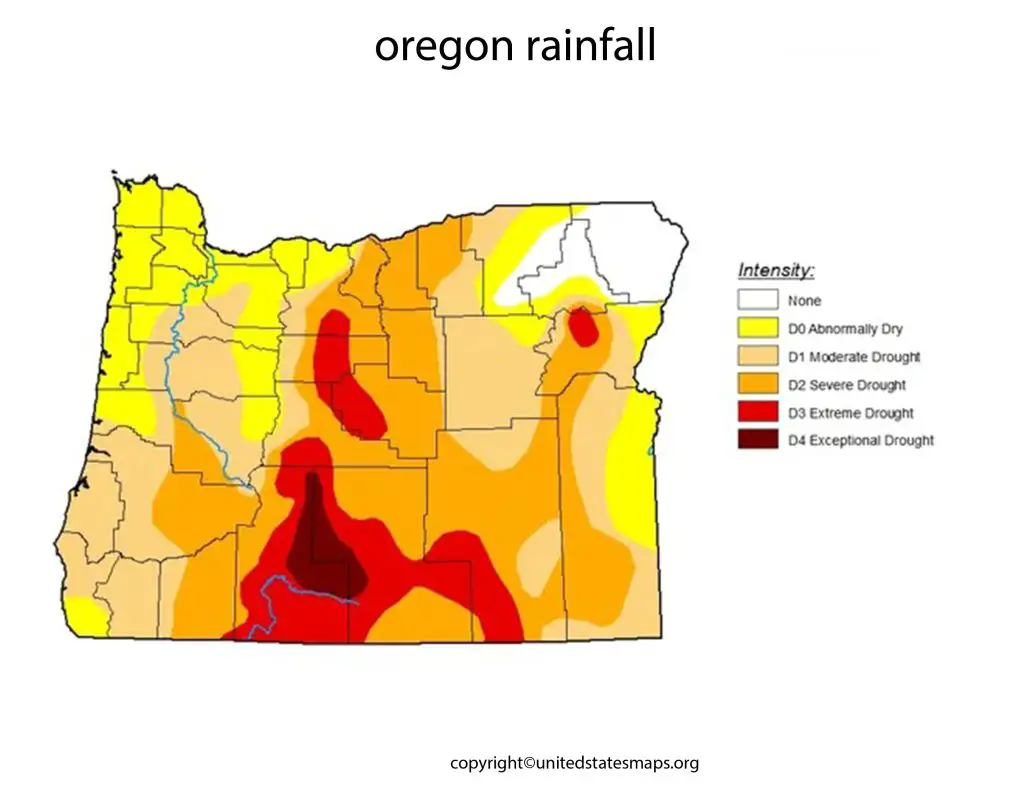
The Rainfall Map of Oregon also shows the changes in precipitation patterns over time, crucial for understanding the impacts of climate change on the state’s water resources. By monitoring changes in the map over the years, scientists can determine how rainfall patterns are evolving and help prepare for the potential impacts of future climate change.
Oregon Annual Rainfall Map
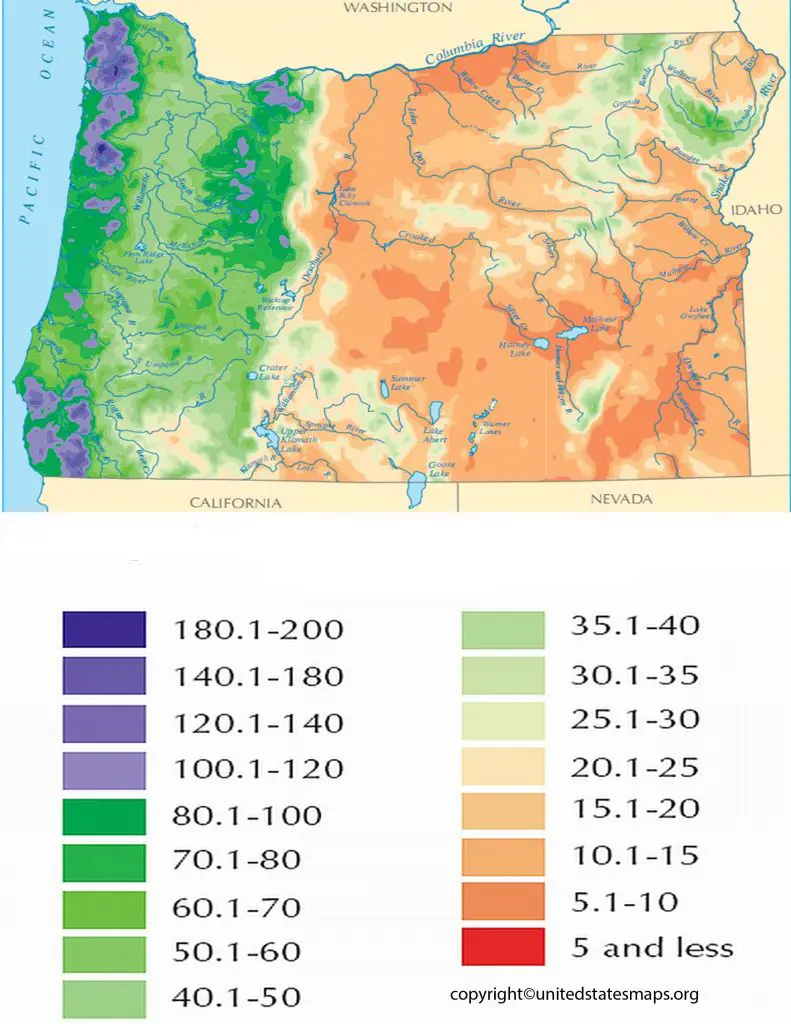
The Oregon Average Rainfall Map displays the average precipitation levels across the state. The map provides an overview of how much rainfall each county receives annually and highlights the areas of the state that are most and least affected by precipitation.
The Oregon Annual Rainfall Map shows the average precipitation levels for each county in Oregon. The map a useful tool for farmers, water managers, and other stakeholders who rely on rainfall to support their livelihoods.
The map reveals that the coastal region of Oregon receives the most significant amount of rainfall annually, with some counties receiving over 100 inches per year. In contrast, the eastern region receives less than 10 inches annually. The Willamette Valley and the Cascade Range fall in between these extremes, with annual precipitation levels ranging from 20-60 inches.
The Oregon Annual Rainfall Map can help farmers decide what crops to plant and when to irrigate. It can also assist water resource managers in predicting water availability and planning for droughts. Moreover, it helps residents of Oregon understand the rainfall patterns in their area and prepare for any potential water-related hazards.