The Hawaii Rainfall Map is a valuable resource for anyone living in or planning to visit the islands. Our comprehensive map provides users with a clear understanding of the average rainfall levels across the state, enabling them to plan their activities accordingly. Whether you’re a beachgoer, a hiker, or an outdoor enthusiast, our Rainfall Map of Hawaii is an indispensable tool to help you stay prepared and make informed decisions.
Check out our other Rainfall related Maps:
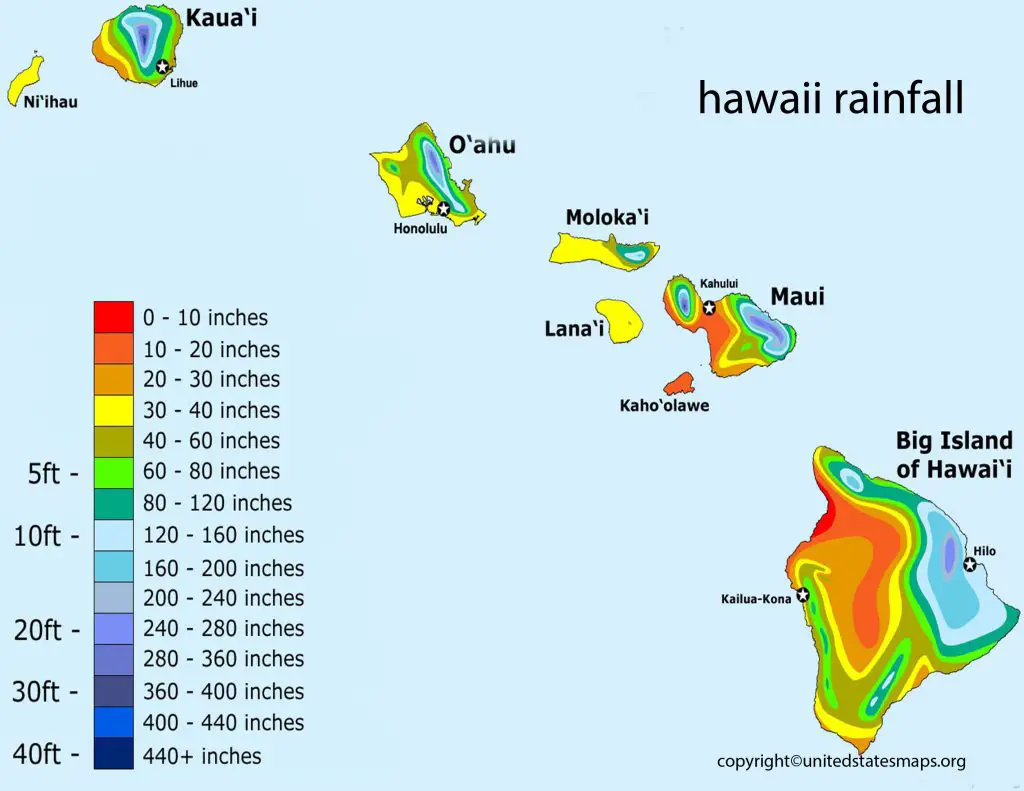
Hawaii is known for its breathtaking natural beauty, including its lush tropical forests, white sandy beaches, and stunning waterfalls. However, the islands also known for their unique weather patterns, including high levels of rainfall. A Hawaii rainfall map is a valuable tool for locals and visitors alike, helping them to better understand the climate patterns on the islands.
The average rainfall in Hawaii is an important metric for understanding the islands’ unique climate patterns. With a range of diverse ecosystems and microclimates, rainfall levels can vary significantly across the islands, impacting everything from agriculture to tourism.
On average, Hawaii receives between 20 and 40 inches of rainfall per year, depending on the region. The wettest areas typically found on the windward sides of the islands, where moist air is forced to rise over the mountains, leading to increased precipitation. In contrast, the leeward sides of the islands much drier, as the mountains block moisture from the prevailing trade winds.
One of the most striking features of Hawaii Average Rainfall is the variability across different regions of the islands. For example, the island of Kauai is known for its wettest spot in the world, Mount Waialeale, which receives an average of 450 inches of rainfall per year. In contrast, the island of Lanai is much drier, with an average annual rainfall of only 37 inches.
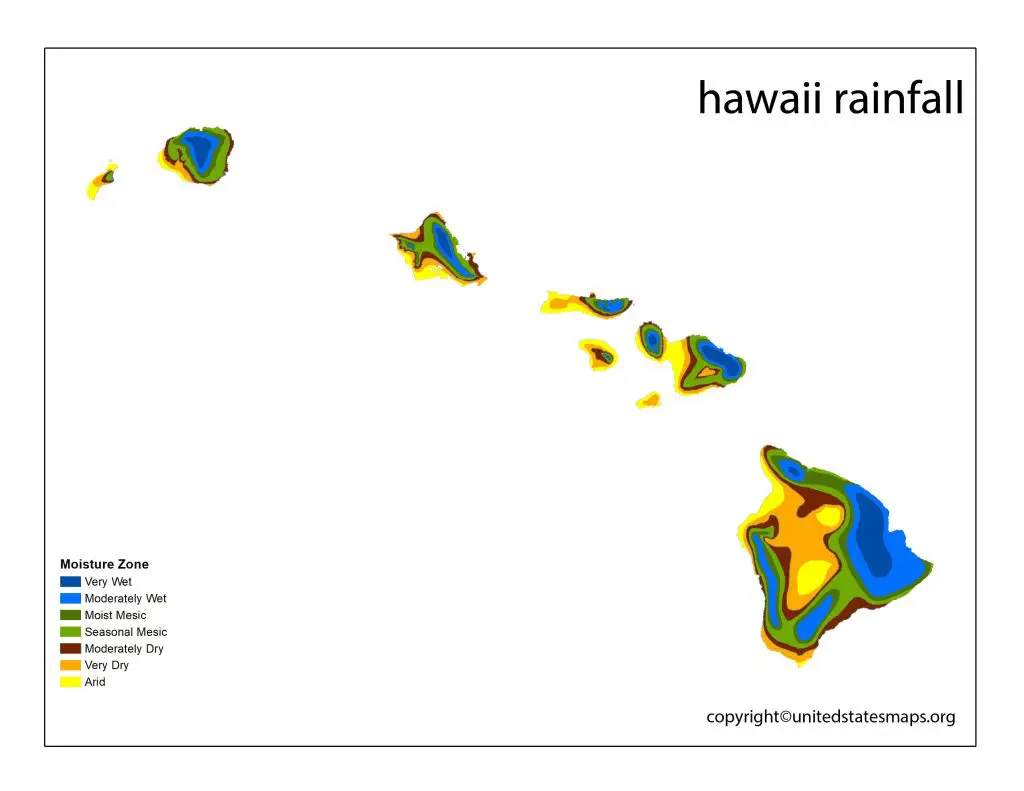
Another interesting feature of the Hawaii rainfall map is the impact of elevation on rainfall levels. As you climb higher in elevation, the temperature drops, and the moisture in the air is more likely to condense into clouds and precipitation. This means that areas with higher elevations, such as the peaks of Mauna Kea and Mauna Loa, tend to receive more rainfall than lower-lying areas.
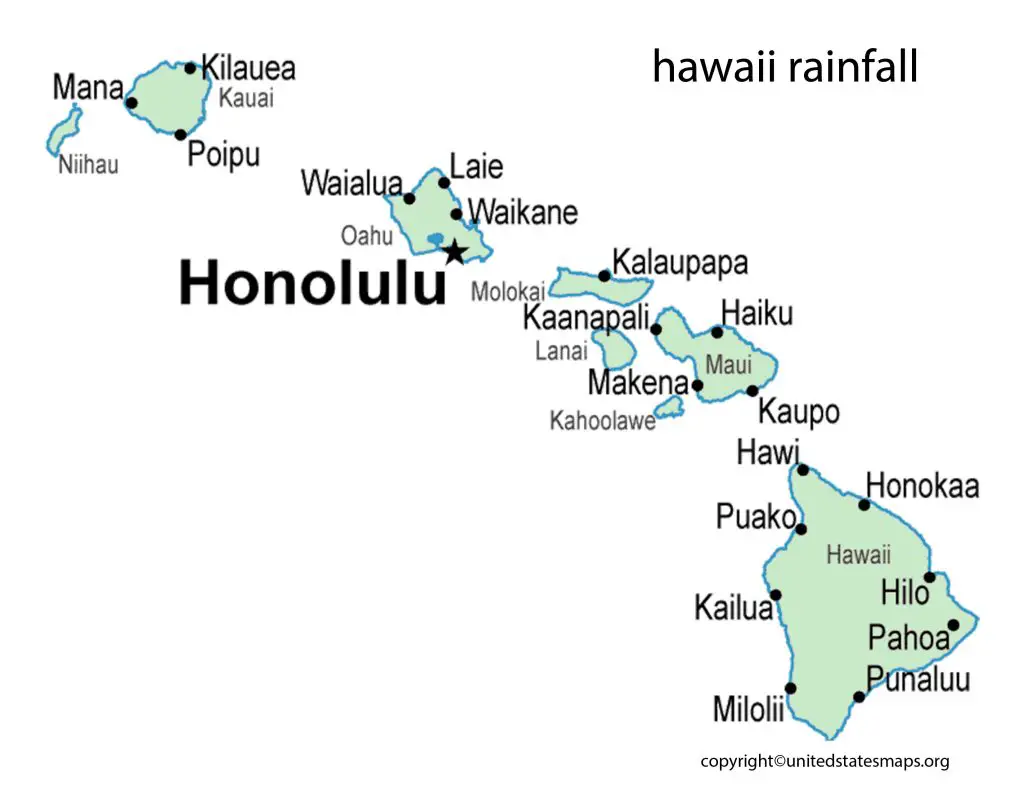
Rainfall Map of Hawaii
A rainfall map Hawaii is a valuable tool for understanding the distribution of precipitation across the islands. With a range of diverse ecosystems and microclimates, rainfall levels can vary significantly across different regions of the islands, impacting everything from agriculture to tourism.
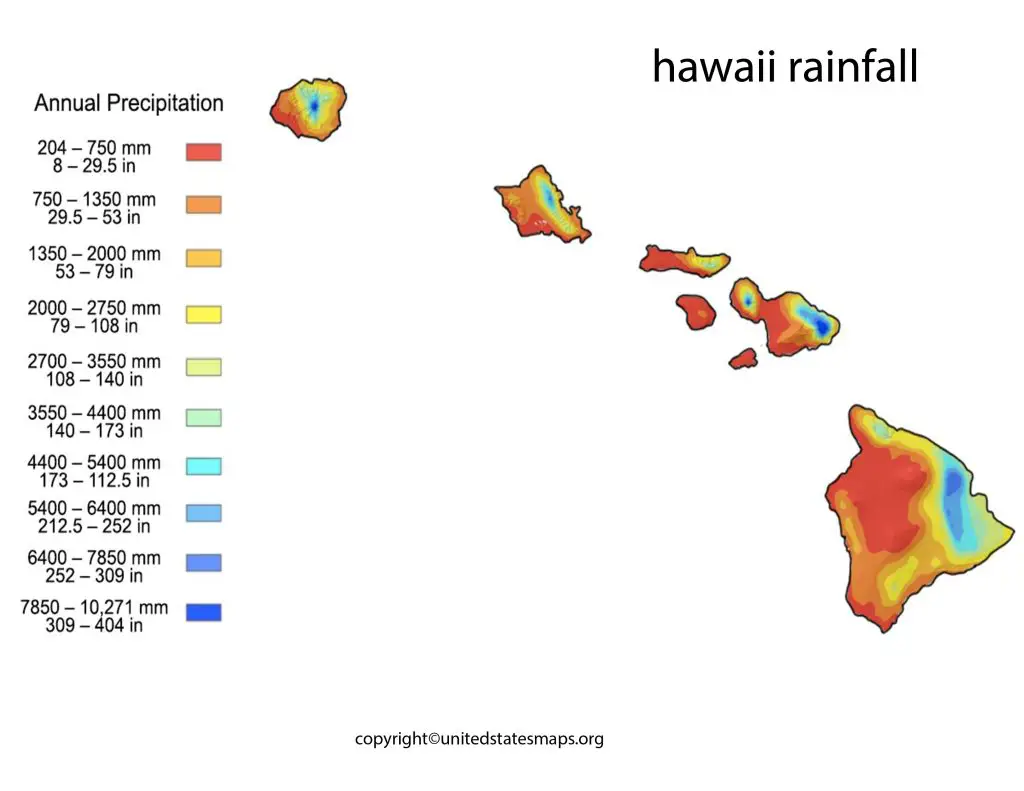
The rainfall map of Hawaii provides valuable insights into the climate patterns of this beautiful archipelago. With a range of diverse ecosystems and microclimates across the islands, understanding the distribution of rainfall is critical for a variety of applications, from agriculture to tourism.
One of the most striking features of the rainfall map of Hawaii is the variability in rainfall levels across the islands. For example, the island of Kauai is known for its wettest spot in the world, Mount Waialeale, which receives an average of 450 inches of rainfall per year. In contrast, the island of Lanai is much drier, with an average annual rainfall of only 37 inches.
Another interesting feature of the rainfall map of Hawaii is the impact of topography on precipitation. As moisture-laden trade winds forced to rise over the mountains, they cool and condense, leading to increased rainfall on the windward side of the islands. This effect is most pronounced on the island of Maui, where the west Maui mountains receive more than 300 inches of rainfall per year, while the leeward side of the island is much drier.
By understanding the distribution of rainfall across the islands, farmers can make informed decisions about crop selection and irrigation strategies. Tourists can plan their activities and prepared for any weather conditions. And scientists can use the data to better understand the complex climate patterns of this unique archipelago.
Hawaii Big Island Rainfall Map
The most striking features of the rainfall map of Hawaii is the variability in precipitation levels across the islands. The windward side of the islands typically receives the most rainfall, as moisture-laden trade winds forced to rise over the mountains, leading to increased precipitation. In contrast, the leeward side of the islands is much drier, as the mountains block moisture from the prevailing trade winds.
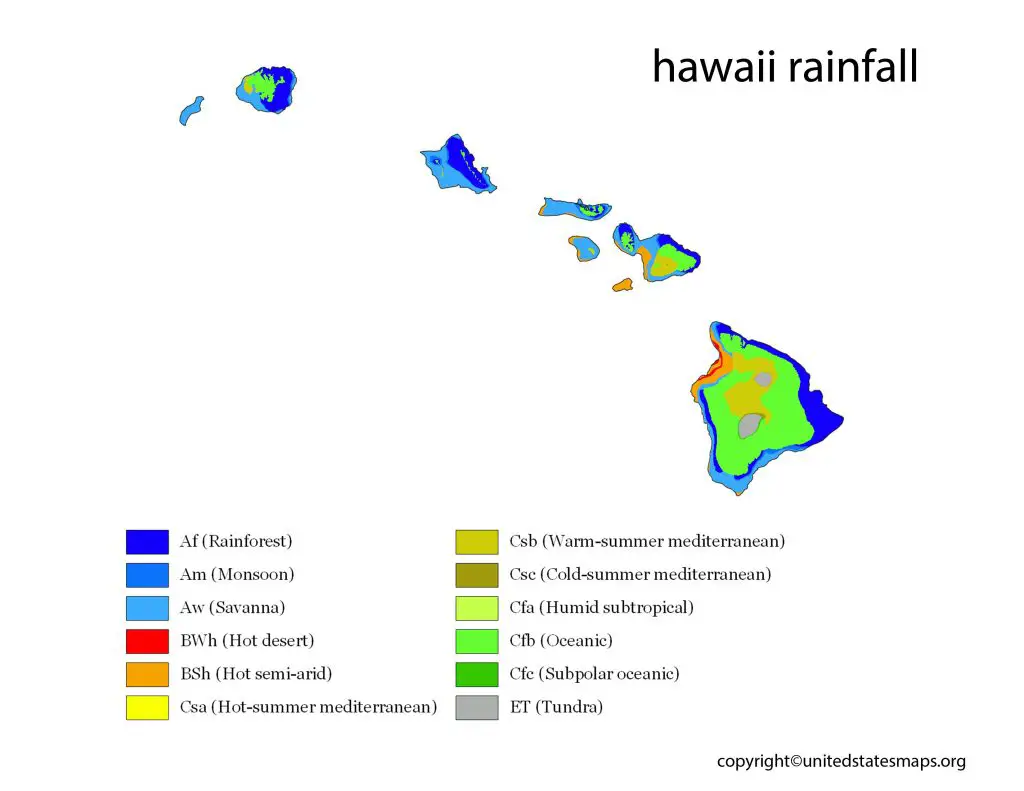
The Big Island of Hawaii is the largest and most diverse of the Hawaiian Islands, with a wide range of ecosystems and microclimates. The Hawaii Big Island rainfall map is an important tool for understanding the distribution of precipitation across this vast island.
One of the most striking features of the Hawaii Big Island rainfall map is the significant variability in rainfall levels across different regions of the island. The windward side of the island, facing the prevailing trade winds, receives the most rainfall, while the leeward side is much drier. The island’s highest peaks, including Mauna Kea and Mauna Loa, also receive higher levels of precipitation due to their elevation.
Another interesting feature of the Hawaii Big Island rainfall map is the impact of volcanic activity on precipitation. The island’s active volcanoes, including Kilauea and Mauna Loa, can create localized weather patterns that result in increased rainfall. For example, the area around Kilauea has known to receive more rainfall than neighboring regions due to the volcanic activity.