Minnesota Rainfall Map: Minnesota is known for its extreme weather conditions, including frequent rainfall, snow, and thunderstorms. The Minnesota Rainfall Map offers insights into the annual precipitation levels across the state. With this map, individuals can plan their activities accordingly, whether it’s farming, outdoor recreation, or weather forecasting.
Check out our other Rainfall related Maps:
- California Rainfall Map
- Texas Rainfall Map
- Colorado Rainfall Map
- Oregon Rainfall Map
- Arizona Rainfall Map
- Hawaii Rainfall Map
Minnesota Rainfall Map
The state of Minnesota is situated in the country’s northern area. The state is renowned for its breathtaking natural surroundings and picturesque landscape, which includes thousands of lakes, rivers, and woods. The state’s annual rainfall is one of the most significant elements that contributes to its varied environment. Rainfall has a significant impact on how the environment is shaped, from sustaining crops to forming lakes and rivers.
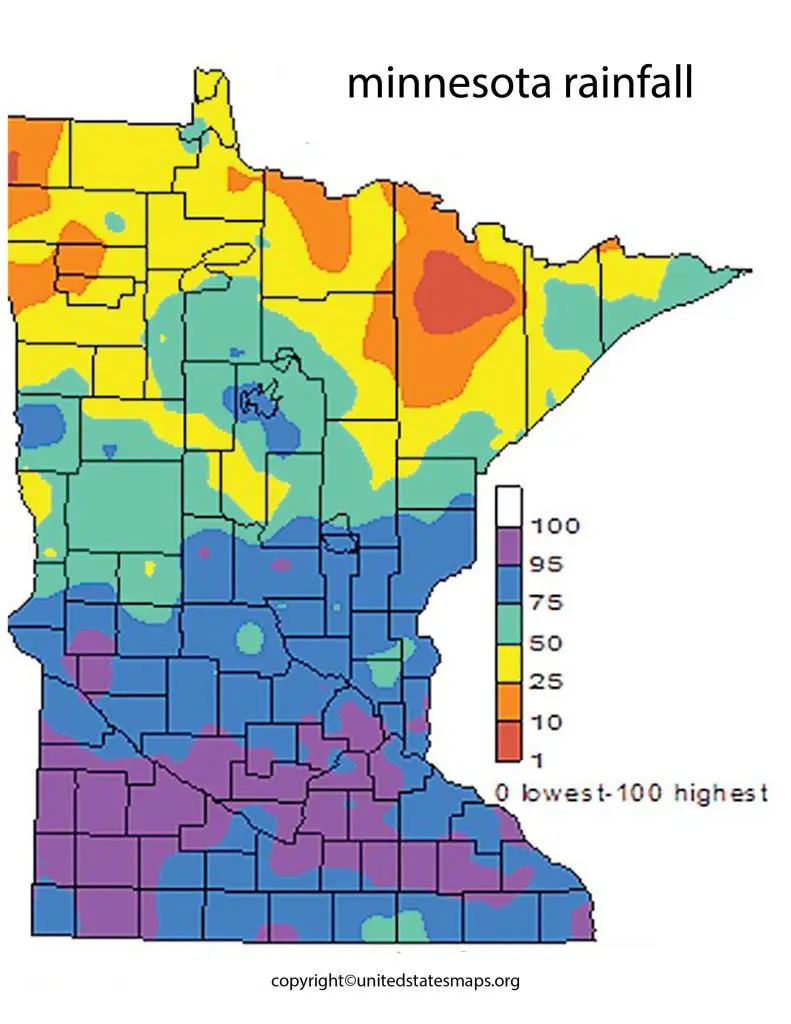
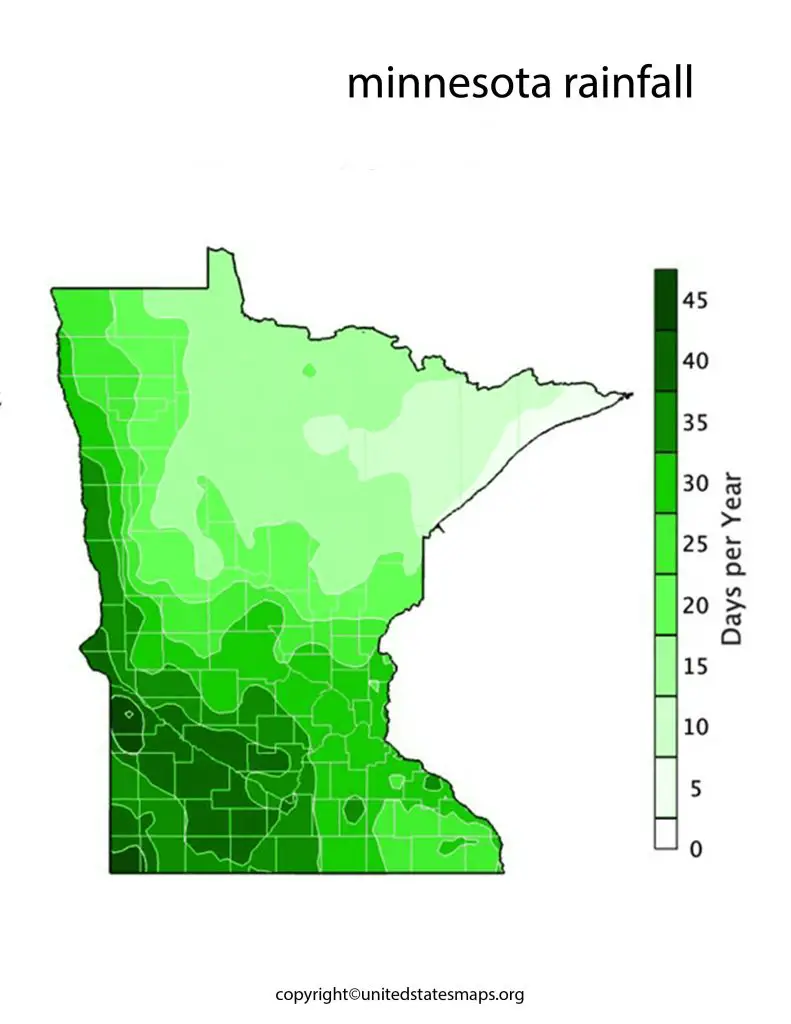
The Minnesota Rainfall Map a visual representation of the amount of rainfall that falls across the state each year. This map provides valuable information for farmers, meteorologists, and anyone interested in the state’s weather patterns. The map shows the average amount of rainfall for each county in the state, and it also highlights the areas that receive the most and least rainfall.
According to the Minnesota Rainfalls Map, the state receives an average of 30 inches of rainfall each year. However, the amount of rainfall varies significantly across the state. The southeastern region of the state, which includes cities like Rochester and Winona, receives the most rainfall, with an average of 40 inches per year. In contrast, the northwestern region of the state, which includes cities like Moorhead and Crookston, receives the least amount of rainfall, with an average of 20 inches per year.
The Minnesota Rainfall Map an important tool for farmers and other agricultural professionals. Knowing the amount of rainfall that falls in a particular region can help farmers make informed decisions about crop planting, irrigation, and other important agricultural practices. The map can also help meteorologists and other weather experts make more accurate predictions about future weather patterns in the state.
Rainfall Map of Minnesota
The Rainfall Totals Map Minnesota is a visual representation of the amount of rainfall that falls across the state each year. This map an important tool for anyone interested in the state’s weather patterns, environment, and economy.
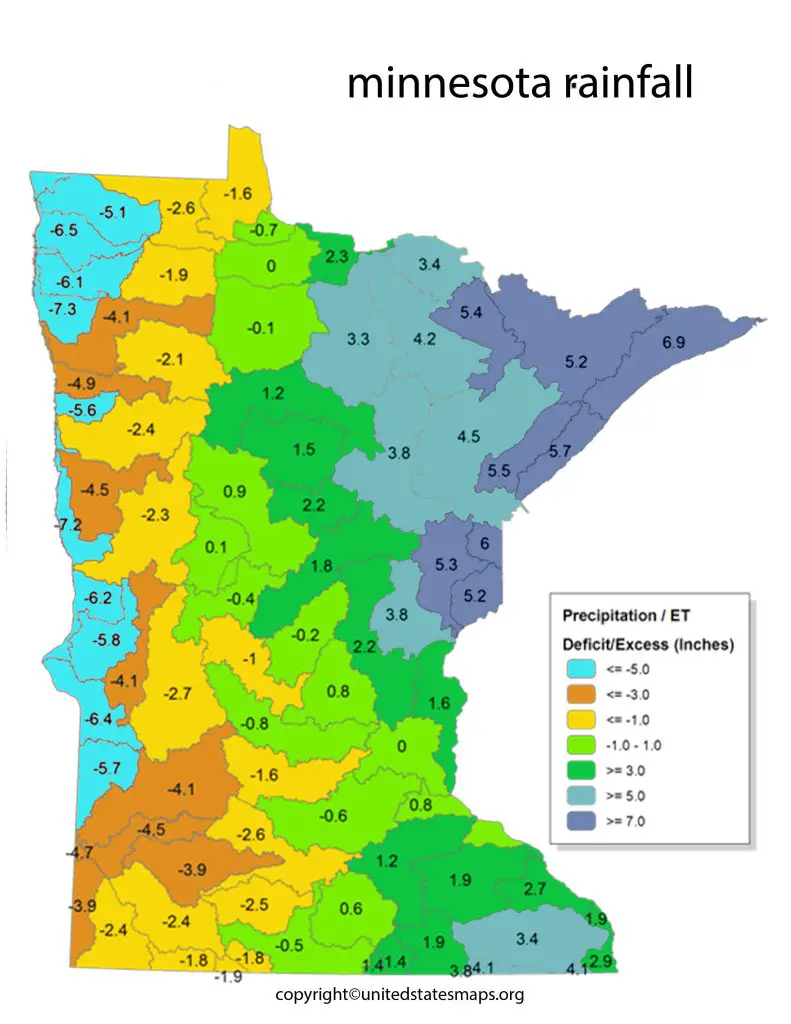
The Rainfall Map of Minnesota shows that the state receives an average of 30 inches of rainfall each year. However, this amount varies significantly across the state. The southeastern region of the state, which includes cities like Rochester and Winona, receives the most rainfall, with an average of 40 inches per year. In contrast, the northwestern region of the state, which includes cities like Moorhead and Crookston, receives the least amount of rainfall, with an average of 20 inches per year.
The Rainfall Map of Minnesota also useful for understanding the impact of weather patterns like El Niño and La Niña on the state’s rainfall. El Niño, for example, can cause warmer and wetter conditions in the southeastern part of the state, while La Niña can bring drier conditions to the northwestern part of the state.
The Rainfall Map of Minnesota an important tool for farmers and other agricultural professionals. Understanding the amount of rainfall that falls in a particular region can help farmers make informed decisions about crop planting, irrigation, and other important agricultural practices. The map can also help meteorologists and other weather experts make more accurate predictions about future weather patterns in the state.
Minnesota Rainfall Totals Map
The Rainfall Map Minnesota provides a visual representation of the amount of rainfall that falls across the state each year. This map a valuable resource for anyone interested in the state’s weather patterns and environment, and it provides important information for farmers, meteorologists, and other professionals.
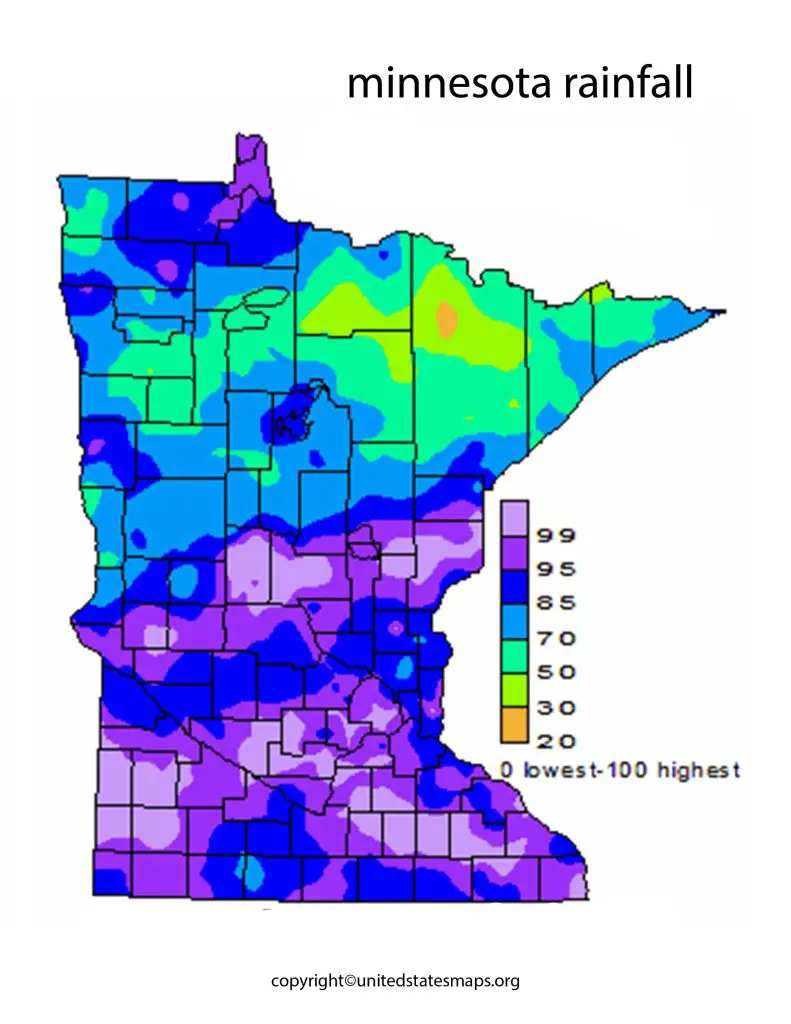
According to the Minnesota Rainfall Totals Map, the state receives an average of 30 inches of rainfall each year. However, the amount of rainfall varies significantly across the state. The southeastern region of the state, which includes cities like Rochester and Winona, receives the most rainfall, with an average of 40 inches per year. In contrast, the northwestern region of the state, which includes cities like Moorhead and Crookston, receives the least amount of rainfall, with an average of 20 inches per year.
The Minnesota Rainfall Totals Map an important tool for understanding how rainfall affects the state’s environment. For example, areas that receive more rainfall more likely to have lush forests and abundant wildlife, while areas with less rainfall may more prone to drought and wildfires. The map can also help identify areas that at risk for flooding during periods of heavy rainfall.
Overall, the Minnesota Rainfall Totals Map a valuable resource for anyone interested in the state’s weather patterns and environment. It provides important information about the amount of rainfall that falls in different parts of the state and can help farmers, meteorologists, and other professionals make more informed decisions.