The US climate map can be very useful in understanding the temperature of different regions. The US has 50 states and every state has different climatic conditions. USA climate map helps in a clear understanding of different states. The climate map illustrates how the temperature varies among different states and how different climatic zones are divided. This map of the US climate illustrates how different regions have different climatic conditions. The Climate map defines different weather patterns of an area.
US Climate Map
The climate Map depicts the climatic variables such as temperature, humidity, wind speed, precipitation etc. Different states have different climatic conditions, some of them are hot, cold, snow, rainy. The latitude plays an important role in defining the climatic conditions of an area. The US climate map can be downloaded and printed from the below-given image and be used for further reference.
US Climate Map Printable
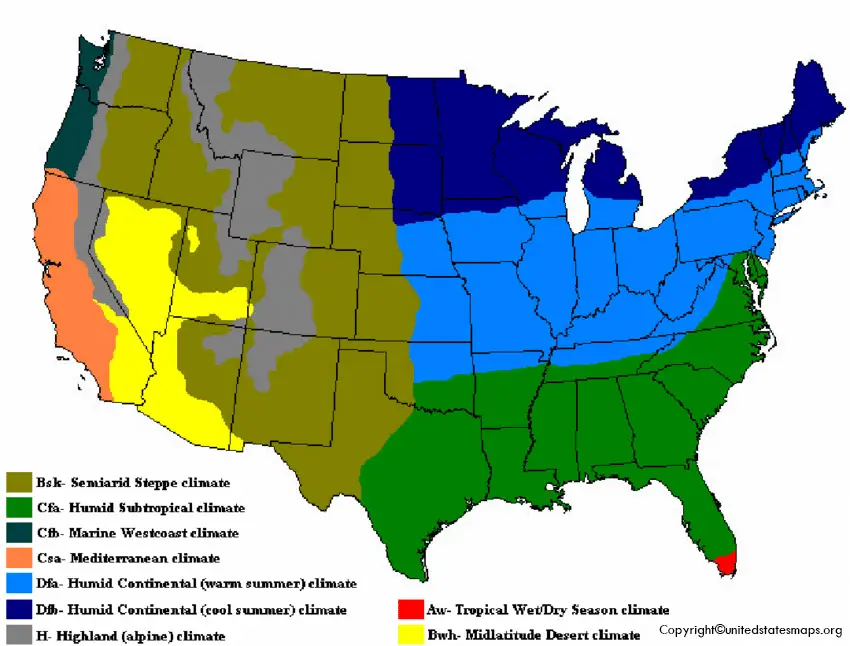
The climate Map of the US can be divided into different climatic types:
1- Humid Continental (warm summer)
2- Humid Continental (cool summer)
3- Highland (alpine)
4- Tropical wet/ Dry season
5- Midlatitude desert
6- Semiarid steppe
7- Humid subtropical
8- Marine Westcoast
9- Mediterranean
The different climatic types describe the different weather conditions of the state. In this Climate map, different areas have been marked with different colors and the area with light blue and dark blue color represents the humid continental (warm summer and cold summer), the red represents the tropical wet/ dry season, the yellow represents the mid-latitude desert, the brown represents the semi-arid steppe, the light green color represents the humid subtropical area, the dark green represents the marine west coast and the orange represents the Mediterranean.
Climate Map of US
The climate map shows different climatic types and the map for different climatic types can be downloaded and printed from the below reference.
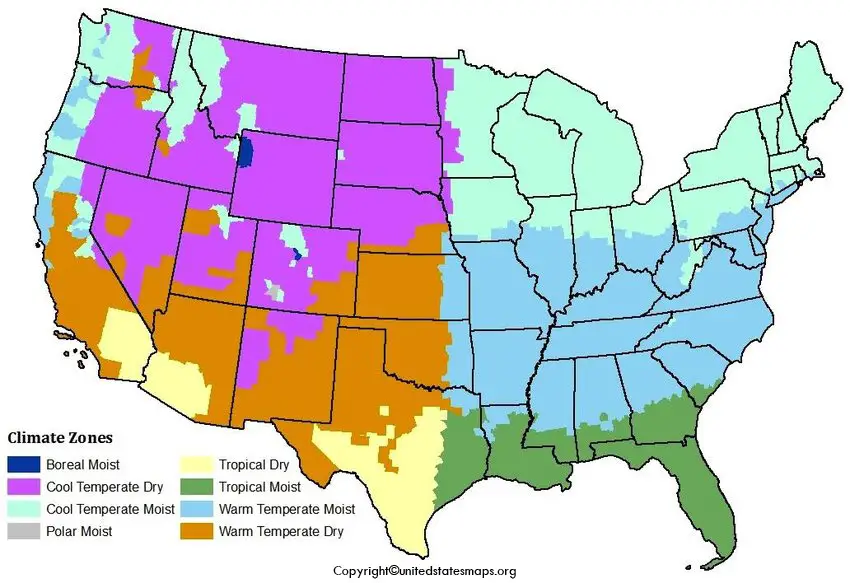
The climate map of the US has different climatic zones: There are 8 climatic zones according to IPCC
1- Boreal moist
2- Cool temperate dry
3- Cool temperate moist
4- Polar moist
5- Tropical dry
6- Tropical moist
7- Warm Temperate Moist
8- Warm Temperate Dry
These climatic zones are defined by IPCC and the map for the following climatic zones can be downloaded and printed from the below reference.
A free printable Climate Map of the US can be downloaded and printed and can be used for further reference.
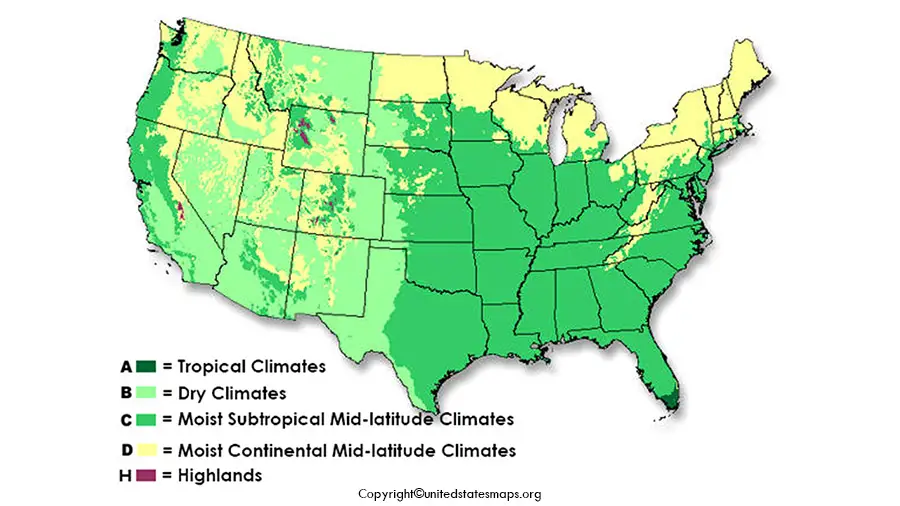
The climate Map of the US has been divided into 6 main climatic zones:
1- Tropical Climates
2- Dry Climates
3- Moist Subtropical Mid-Latitude Climate
4- Moist Continental Mid-Latitude Climate
5- Polar Climates
6- Highlands
America Climate Map
The Climate Map of the US can be downloaded and printed from the below image and be used for further reference. All climate map is a result of different factors such as humidity, wind speed, precipitation, etc.
The different climatic zones have been explained in the images and different states have different climatic regions and zones. This climate map of the US explains the different regions and zones of the US State.
A U.S. Climate Map visually represents the diverse climatic zones across the United States. It highlights variations in temperature, precipitation, and other climate characteristics, influenced by geography, elevation, and proximity to water bodies. Here’s a detailed breakdown:
Purpose of a U.S. Climate Map
- To show the geographical distribution of climate zones across the country.
- To provide insights into weather patterns, precipitation levels, and seasonal variations.
- Useful for education, agriculture, urban planning, and travel.
Key Features of a U.S. Climate Map
- Climate Zones:
- Based on the Köppen Climate Classification System, one of the most commonly used methods to categorize climates globally. Zones in the U.S. include:
- Tropical (A): Found in parts of southern Florida and Hawaii, with hot, humid conditions year-round.
- Arid (B): Includes deserts in the Southwest (e.g., Arizona, Nevada) and semi-arid areas in the Great Plains.
- Temperate (C): Covers much of the Southeast, parts of the Pacific Coast, and areas with mild winters and warm summers.
- Continental (D): Dominates the Midwest, Northeast, and Great Plains, characterized by cold winters and hot summers.
- Polar (E): Found in Alaska, featuring extremely cold temperatures most of the year.
- Based on the Köppen Climate Classification System, one of the most commonly used methods to categorize climates globally. Zones in the U.S. include:
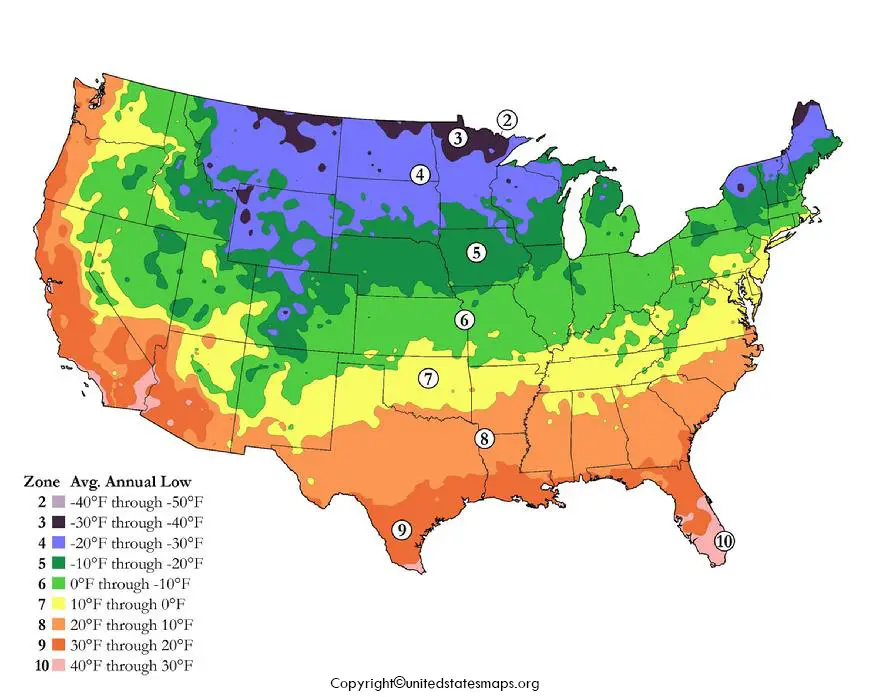
- Temperature Gradients:
- Maps often use color coding to depict average annual temperatures:
- Red/Orange: Warmer regions (e.g., Southern California, Texas, Florida).
- Blue/Purple: Cooler regions (e.g., Alaska, Northern Rockies, Upper Midwest).
- Green/Yellow: Moderate regions (e.g., Pacific Northwest, parts of the Southeast).
- Maps often use color coding to depict average annual temperatures:
- Precipitation Patterns:
- Shows areas with high rainfall (e.g., Pacific Northwest) and arid zones (e.g., Southwestern deserts).
- Symbols or shading may indicate snowfall in regions like the Rockies or New England.
- Seasonal Variations:
- Some maps include overlays for seasonal weather, showing areas prone to:
- Winter Storms: Northern states like Minnesota, Michigan, and Maine.
- Hurricanes: Gulf Coast and Southeastern states like Florida and Louisiana.
- Tornadoes: “Tornado Alley” in the central U.S., including Texas, Oklahoma, Kansas, and Nebraska.
- Some maps include overlays for seasonal weather, showing areas prone to:
Regional Climate Descriptions
- Northeast:
- Climate Zone: Humid continental.
- Characteristics: Cold, snowy winters and hot, humid summers.
- States: Includes New York, Pennsylvania, Massachusetts, and others.
- Southeast:
- Climate Zone: Humid subtropical.
- Characteristics: Hot, humid summers; mild winters; significant rainfall year-round.
- States: Includes Florida, Georgia, Alabama, and the Carolinas.
- Special Features: Vulnerable to hurricanes.
- Midwest:
- Climate Zone: Humid continental.
- Characteristics: Large seasonal temperature swings; cold winters and hot summers.
- States: Includes Illinois, Iowa, Missouri, and others.
- Special Features: Prone to tornadoes and thunderstorms.
- Great Plains:
- Climate Zone: Semi-arid.
- Characteristics: Dry conditions with cold winters and warm summers.
- States: Includes parts of Kansas, Nebraska, and the Dakotas.
- Southwest:
- Climate Zone: Arid and semi-arid.
- Characteristics: Desert-like conditions with high summer temperatures and low rainfall.
- States: Includes Arizona, Nevada, and parts of Texas.
- Special Features: Occasional monsoon rains in late summer.
- Pacific Northwest:
- Climate Zone: Marine west coast.
- Characteristics: Mild, wet winters and cool, dry summers.
- States: Includes Washington, Oregon, and parts of Northern California.
- Special Features: High annual rainfall and dense forests.
- California and Southwest Coast:
- Climate Zone: Mediterranean.
- Characteristics: Wet, mild winters and hot, dry summers.
- States: Includes coastal California and parts of Southern Oregon.
- Rocky Mountains:
- Climate Zone: Highland.
- Characteristics: Varies by elevation; cold winters, cool summers, and heavy snowfall.
- States: Includes Colorado, Utah, Wyoming, and Montana.
- Alaska:
- Climate Zones: Polar (north) and subarctic (south).
- Characteristics: Extremely cold winters and cool, short summers.
- Hawaii:
- Climate Zone: Tropical.
- Characteristics: Warm, humid weather year-round with heavy rainfall in some regions.
Symbols and Features on the Map
- Color Gradient:
- A spectrum of colors differentiates climate zones and temperature ranges.
- Isotherms:
- Lines showing areas of equal temperature.
- Precipitation Symbols:
- Raindrops, snowflakes, or wave patterns for rainfall and snowfall.
- Arrows:
- Indicate prevailing wind directions or ocean currents (e.g., trade winds in Hawaii).
Applications of a Climate Map
- Education:
- Useful in classrooms to teach about weather patterns, ecosystems, and geography.
- Agriculture:
- Helps farmers understand growing seasons, rainfall, and temperature ranges.
- Travel and Tourism:
- Guides travelers to destinations with desired weather (e.g., ski resorts, sunny beaches).
- Urban Planning and Infrastructure:
- Informs building design, energy needs, and disaster preparedness.