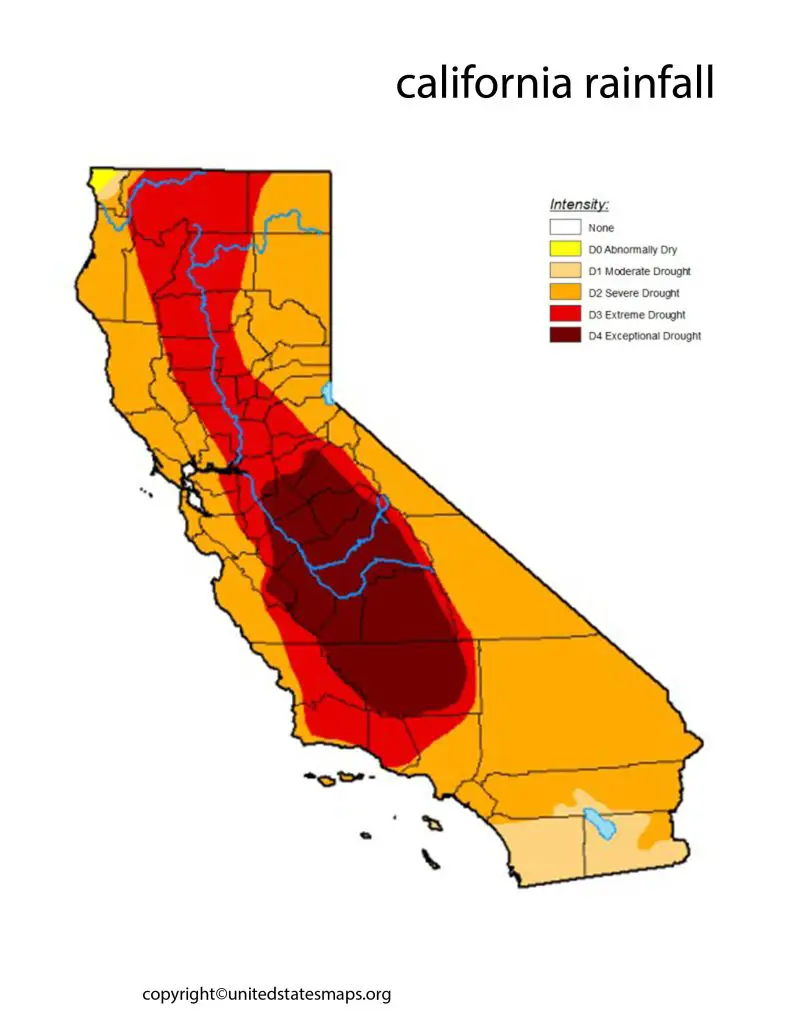
The California Rainfall Map is an indispensable resource for anyone living in or visiting the state. Our comprehensive map provides users with a clear understanding of the average rainfall levels across the state, enabling them to plan their activities accordingly. Whether you’re a surfer, a farmer, or just want to stay informed about the weather, our Rainfall Map of California is an essential tool to help you make informed decisions and stay prepared.
Check out our other Rainfall related Maps:
California Rainfall Map
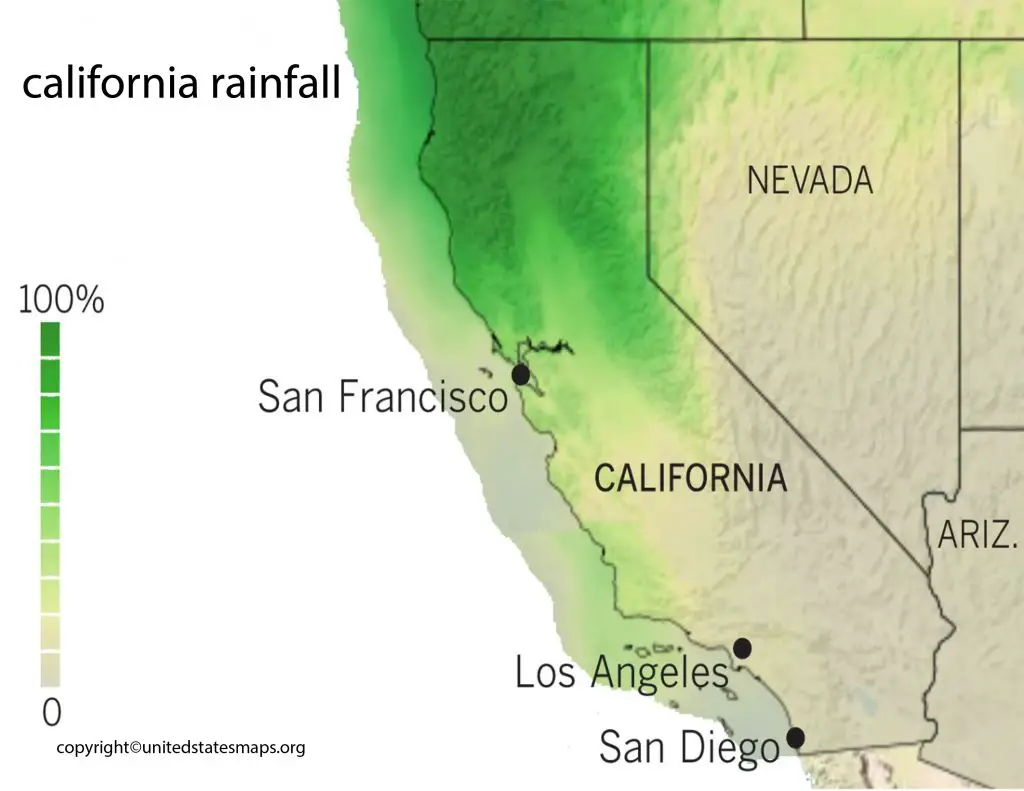
On the west coast of the United States is the state of California. The region’s varied geography, which includes mountains, valleys, and deserts, is well-known. California’s climate varies based on the region. While the southern section of the state is typically drier and warmer, the northern part of the state is typically cooler and wetter.
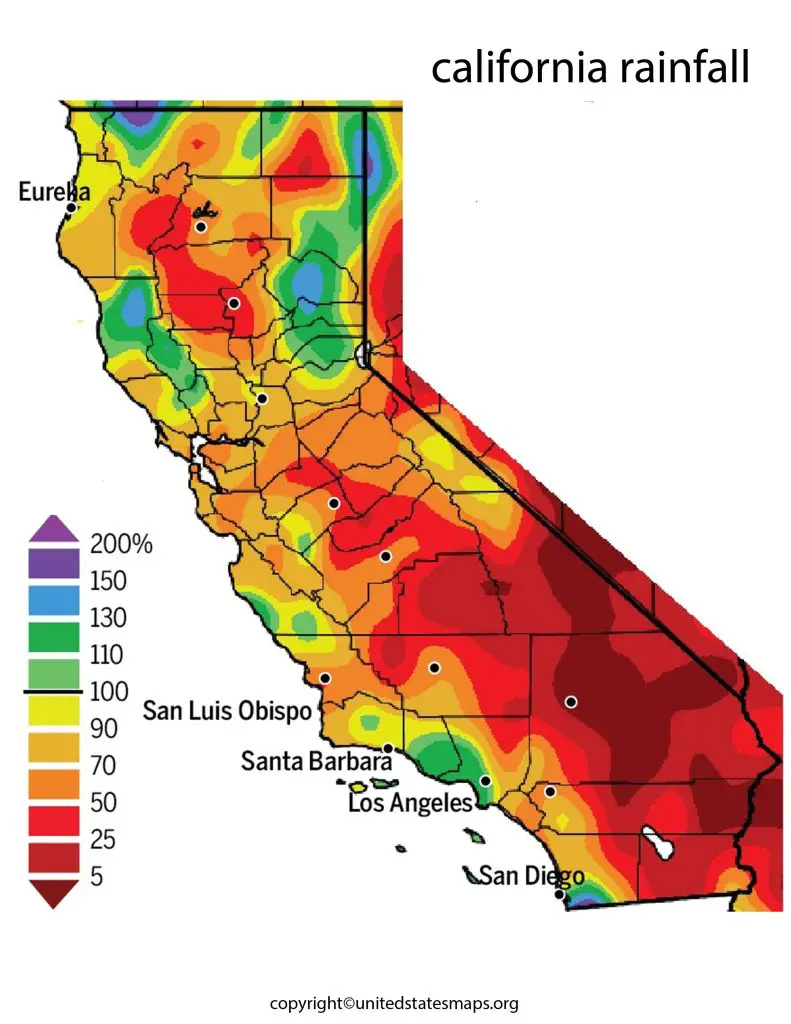
One way to visualize the differences in rainfall across California is through a rainfall map. A rainfall map of California shows the average amount of precipitation that falls in each region of the state. This information can be useful for farmers, urban planners, and anyone interested in California’s natural resources.
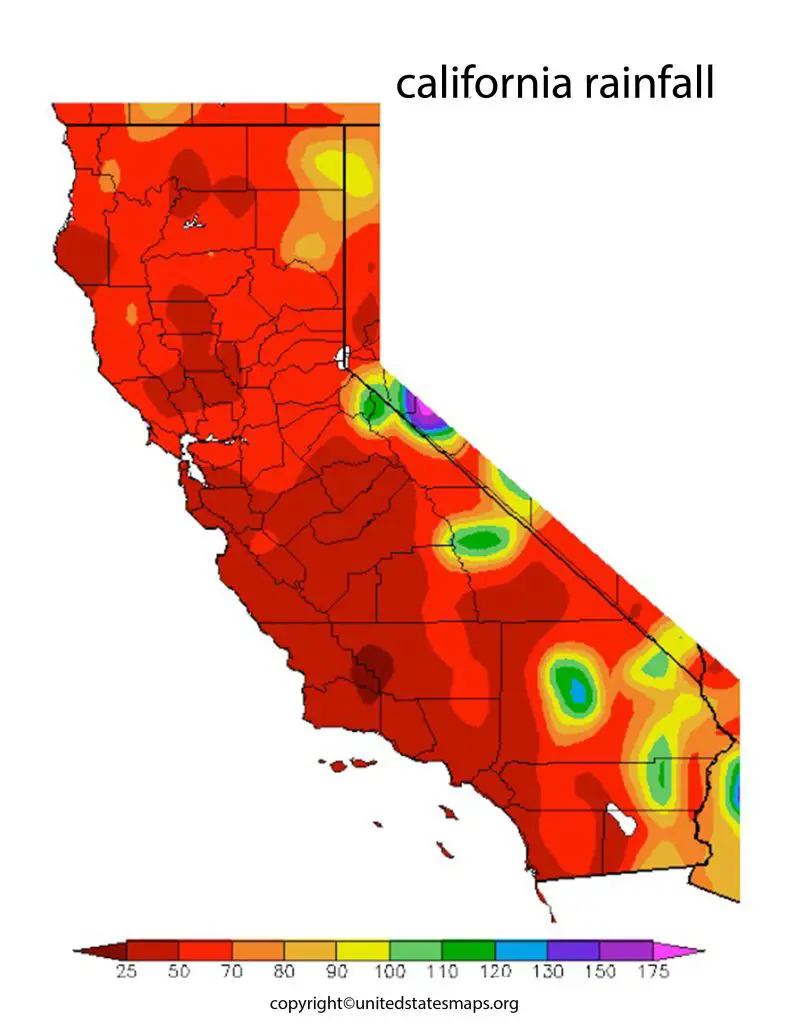
There are several sources for California rainfall maps, including the National Oceanic and Atmospheric Administration (NOAA) and the California Department of Water Resources. These maps are typically color-coded to show areas of high and low precipitation. Some maps may also show the timing of rainfall throughout the year.
A California rainfall map can be useful for several reasons. For example, farmers can use the map to plan their crops and irrigation schedules. Urban planners can use the map to design drainage systems and manage flood risk. Scientists can use the map to study climate patterns and predict future rainfall trends.
In conclusion, a California rainfalls map is a valuable tool for understanding the state’s climate and natural resources. By visualizing the distribution of rainfall across the state, we can gain insights into how the environment affects our lives and livelihoods.
Rainfall Map of California
The California annual rainfall map shows the average amount of precipitation that falls in each region of the state over the course of a year. California is a large state with diverse geography, and the amount of rainfall varies greatly from one region to another.
The rainfall map of California shows the average amount of precipitation that falls in each region of the state. California is a large state with diverse geography, and the amount of rainfall varies greatly from one region to another.
In general, the northern part of the state receives more rainfall than the southern part of the state. This is because the northern part of the state is closer to the Pacific Ocean, which is a major source of moisture. The coastal regions of northern California can receive over 100 inches of rainfall per year, while the deserts of southern California receive less than 5 inches of rainfall per year.
The rainfall map of California is useful for several reasons. Farmers can use the map to plan their crops and irrigation schedules. Urban planners can use the map to design drainage systems and manage flood risk. Scientists can use the map to study climate patterns and predict future rainfall trends.
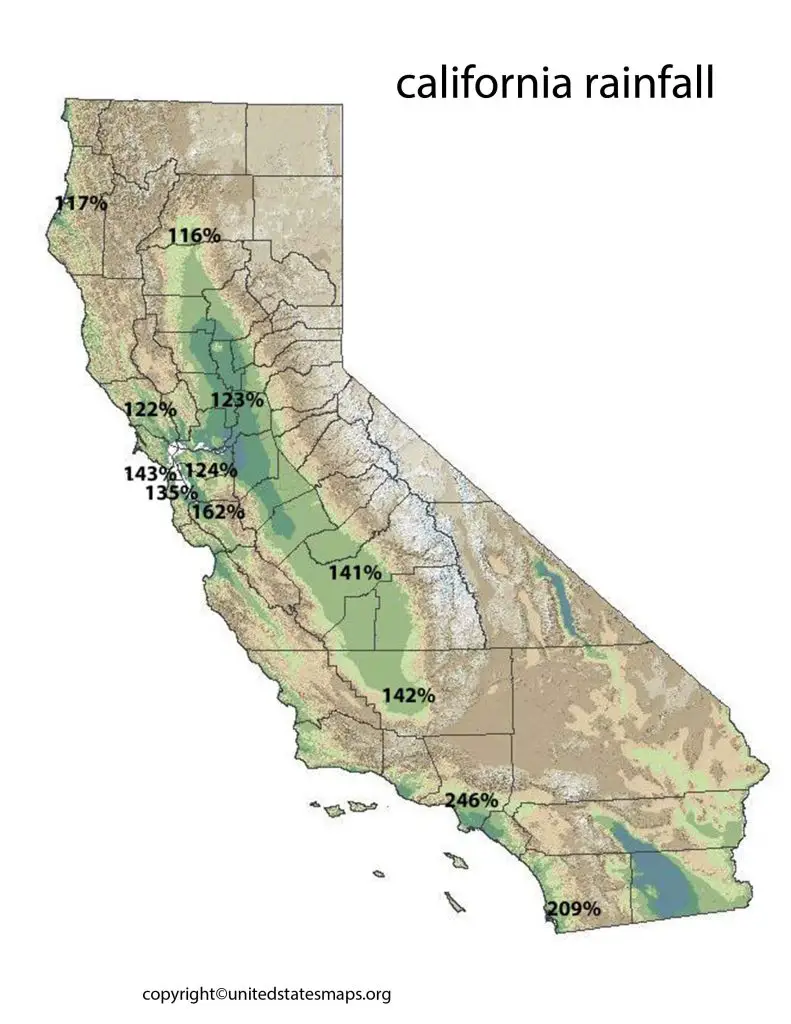
In recent years, California has experienced several severe droughts, which have had significant impacts on the state’s economy and environment. The rainfall map of California can help us understand how these droughts are affecting different regions of the state. For example, during a drought, farmers in the Central Valley may have to rely more heavily on irrigation to water their crops, while urban areas may have to implement water conservation measures to reduce demand.
Annual Rainfall Map California
The average rainfall map California shows the average amount of precipitation that falls in each region of the state over a long period of time, typically 30 years or more. California is a large state with diverse geography, and the amount of rainfall varies greatly from one region to another.
In general, the northern part of the state receives more rainfall than the southern part of the state. The coastal regions of northern California can receive over 100 inches of rainfall per year, while the deserts of southern California receive less than 5 inches of rainfall per year.
The annual rainfall map of California can be useful for several reasons. Farmers can use the map to plan their crops and irrigation schedules. Urban planners can use the map to design drainage systems and manage flood risk. Scientists can use the map to study climate patterns and predict future rainfall trends.
The annual rainfall map of California can also help us understand the impacts of climate change on the state’s environment. In recent years, California has experienced several severe droughts, which have been linked to changes in climate patterns. By comparing the annual rainfall map over time, scientists can track changes in precipitation patterns and identify areas that may be particularly vulnerable to drought or flooding.
One challenge in creating an annual rainfall map of California is that precipitation can vary greatly from year to year. For example, some years may be particularly dry, while other years may be particularly wet. To address this, annual rainfall maps are typically created by averaging precipitation data over a long period of time, such as 30 years or more. But this can help smooth out year-to-year variations and provide a more accurate picture of long-term rainfall patterns.
